
Google sheets is an online spreadsheet application to edit, organize or compile easy to complex data in mins. It’s free to use and it stores all your data on your google drive so it doesn’t take up space on your computer like it does in MS Excel.
Bar graphs are a perfect way to see multiple sets of data in comparison. You can go open a new google sheet by clicking here Or you can write sheets.new in the search bar.
How To Make A Bar Graph in Google Sheets
Bar graphs are usually used to understand and visualize data that is changing. They are best used to compare data together.
Select Cells > Insert > chart
- You need to select all the cells which contain the data you want to see in the graph.
- Click on insert in the toolbar and select chart.
This will show you a graph for your selected data and also show a side bar where you can see the setup of your graph and customize your chart according to your choice.

Second method is to click on Insert Chart directly from the toolbar and it will draw a graph and show the sidebar for editing.
How To Make A Double Bar Graph In Google Sheets
It is as easy as making a single bar graph. You need to select the data for the second bar graph along with the first one for them to appear as double.
You can make a double bar graph in google sheets by selecting data of two different charts at the same time. Example is given below:

How To Make A Percent Bar Graph in Google Sheets
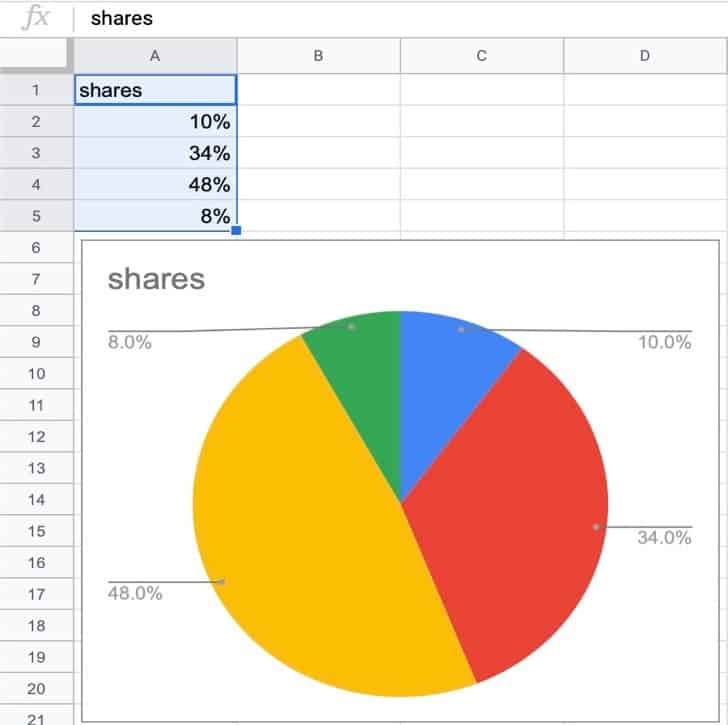
You can make a percent bar graph in google sheets by selecting Pie Chart as your chart type. It will show your data in percentage format.

They are used when we want to show some parts of a data separately. They do not show a format of information changing but rather parts of a whole.
Relevant: Best Googles Docs Tips
How To Make A Stacked Bar Graph in Google Sheets
Stacked bar graph works best when you want to show changes occurring over time in multiple amounts of data in one graph. It shows how smaller parts have relationship with the whole data.

In the Setup section of the Chart editor click on the Chart type and scroll down to the bar graph. The first suggestion will be a standard bar chart on the left, the middle one will be a Stacked bar chart and the third one on the right would be a 100% Stacked bar chart. Choose the type you want your graph to be stacked in.
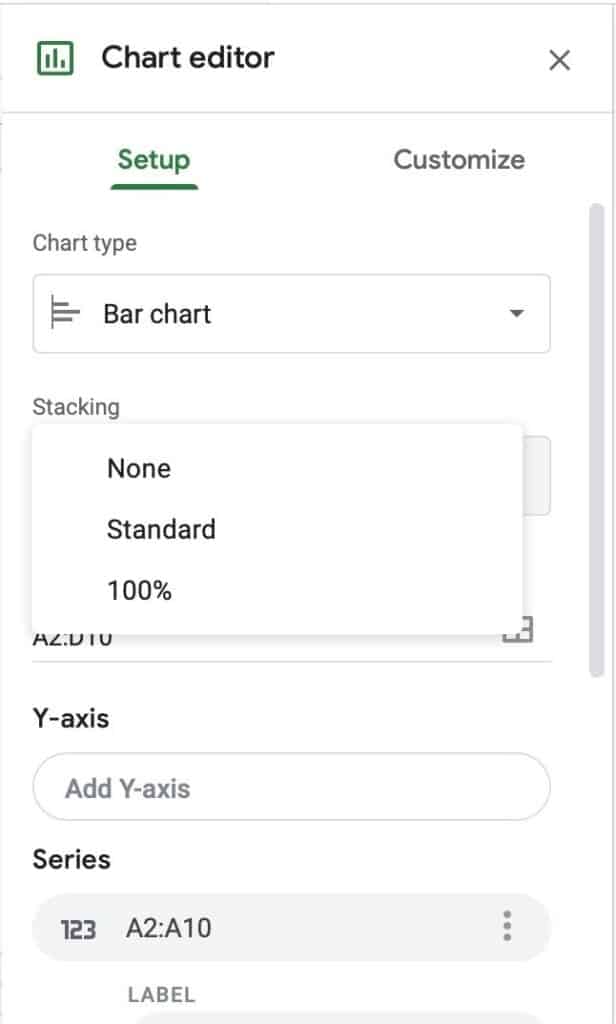

You can also stack your bar graph by choosing the chart you want your data to be displayed in and then you will see under chat type there is an option of Stacking. You can choose to either not stack at all or stack according to your preference.
Customizing The Bar Graph
Customizing the bar graph is extremely easy to do. You only have to click on the part of the graph you want to edit and customize sidebar will open the section where you can edit that part of the graph.

In chart style you can choose what colour to add in the background and what to colour the bar graphs border lines. You can also see your graph in 3D if you want.
In Chart and Axis Titles you can add title and subtitle to your graph along with titles to horizontal and vertical axis. Also, it allows you to choose the font, colour and format of the titles.
In the Series section bar, you can change the bars colour and add data labels and error bars.
In the Legend section, it allows you to edit the position of the legend and so on. It doesn’t hold much importance in bar graphs as much as in pie chart graphs.
The Horizontal axis, Vertical axis and Gridlines section are for editing in detail and intricately according to the demand of the user.
You can check out their workings in detail by getting info straight from google help center by clicking here.
Conclusion:
This was an overall overview on how to make bar graphs and how you can edit and customize them with ease. Making bar graphs from google sheets is the best way to go as it is uncomplicated and effortless to use.